Página inicial
PLUS
Ferramentas de geração de IA
Novo
Gerador de imagens AI
Entregando criatividade à sua imaginação.
Novo
Upscaler de imagem AI
Amplie suas imagens em até 4x com um clique!
Novo
Preenchimento generativo de IA
Remova e substitua objetos em segundos!
Novo
Desfoque de Fundo com IA
Desfocar os fundos para destacar os objetos!
AI Background Remix
Fundos profissionais para seus produtos.
AI Image Extender
Amplie suas imagens para diferentes proporções.
Escrita de IA
O melhor companheiro de escrita para a era digital.
Remoção de fundo de IA
Remova facilmente fundos indesejados.
123RF PLUS
Obtenha soluções criativas com o auxílio de ferramentas de IA de ponta.
Ir para o PLUS
Temos duas novas ferramentas de IA!
Confira agora o Upscaler de imagem AI e o Preenchimento generativo de IA!
OK
Imagens Gratuitas
Stock
Fotos
Vetores
Vídeos
Áudios
Fontes
Corporate+
Preços
Ajuda
br
English
Deutsch
Español
Français
Magyar
Italiano
日本語
한국어
Nederland
Język polski
Português (PT)
Português (BR)
Русский язык
简体中文
繁體中文
Türkçe
Login
Vá ilimitado
Pesquisa por imagem
Pesquise no 123RF com uma imagem em vez de texto. Tente arrastar uma imagem para a caixa de pesquisa.
Arraste e solte o arquivo ou
Navegar
Arraste a imagem aqui
Todas as Imagens
Opções
Pesquisa por imagem
PREMIUM
Todas as Imagens
Fotos
Vetores
Vídeos
Áudios
Fontes
FREE
PLUS
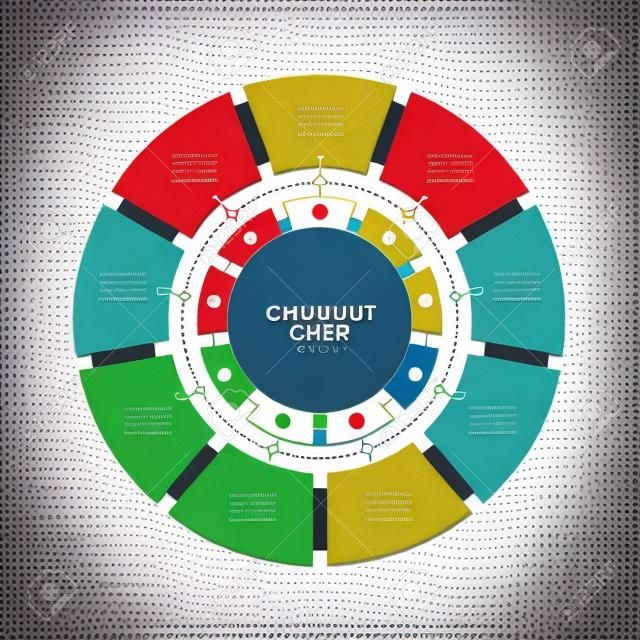
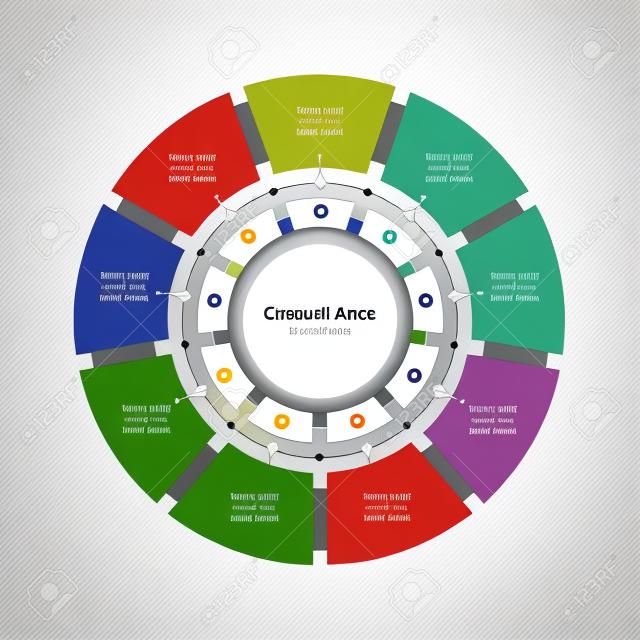
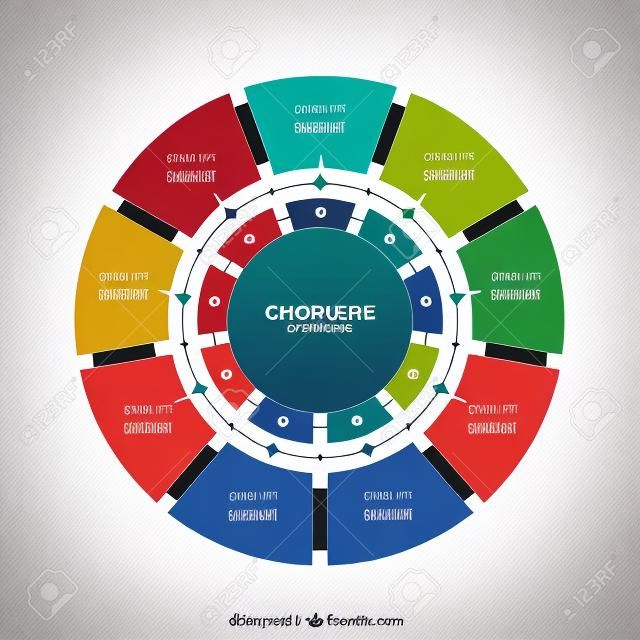
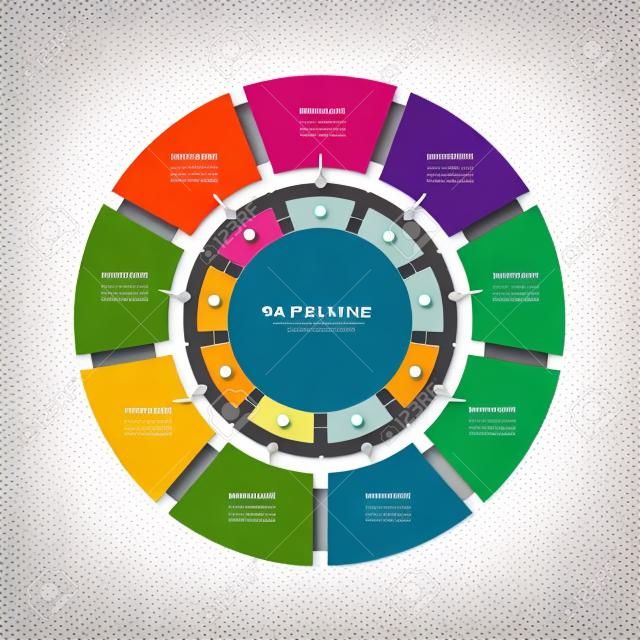
Infographic circular chart divided into 9 parts. Step-by step cycle diagram with nine options designed for report, presentation, data visualization.
AI Variation
AI Variation
AI Variation
AI Variation
vectorcreator
Siga
Pré-visualização
Compartilhar
X
Facebook
Pinterest
146626708
Vetor de Banco de imagens
(SVG ou EPS)
Pesquisas de banco de imagens
workflow
process
circular
plot
graph
report
layout
chart
arrow
analysis
diagram
editable
nine
graphic
split
statistics
infochart
vector
connection
strategy
stats
segment
part
result
idea
banner
cycle
element
step
research
information
flowchart
progress
schedule
presentation
flow
template
concept
development
data
audit
circle
pie
infographic
divided
plan
option
web
analyze
Imagens de estoque semelhantes (Vetor, SVG e EPS)


 Pinterest
 146626708

 Novo
Novo
 Novo
Novo
 Novo
Novo


 146626708